
Your optimal training frequency for the glutes: part II
The following article on glute training is written by Stijn van Willigen. Stijn now works for Bayesian Bodybuilding full-time. While this isn’t exactly Menno’s approach to glute training, it’s very much based on the Bayesian Bodybuilding principles of optimal program design. The article is aimed at women but men can benefit from using the same principles. Enjoy it!
– Menno
Words: 3,400
Reading time: 12 minutes
y take-aways
- When it comes to training program design, everyone needs something different. An important aspect is your glute training frequency: how often you train them per week.
- The Stimulus-Recovery-Adaptation curve (SRA) concept helps to determine how long your glutes take to recover from and adapt to a training session.
- Three factors greatly influence the length of the SRA curve: Exercise type (and amount of volume), a muscle’s training status, and mental stress levels.
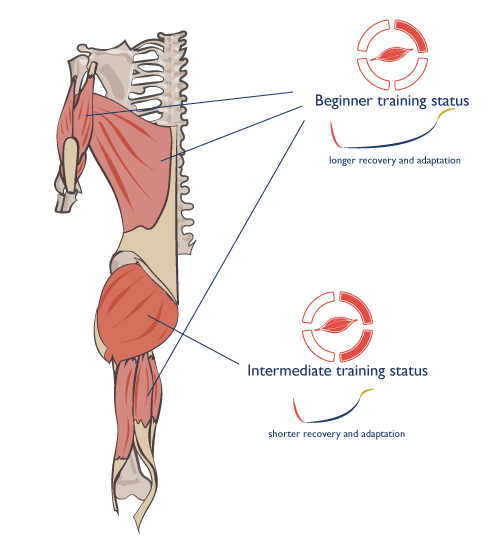
- The more developed your glutes are (training status), the shorter their SRA curves get, and the quicker you can successfully train them again.
- Mental stress slows recovery and adaptation (longer SRA curve), which means you can train the glutes less frequently.
- The calculators in this article estimate the optimal training frequency for your glutes.
- Not only your muscles, but also your central nervous system has an SRA curve. Watch out with training to failure, which may rob you of maximal muscle growth.
Introduction
How often should (wo)men train their backsides for optimal results? In my previous article I showed how different exercise types affect the optimal training frequency for the glutes. Still, many people asked me how they should go about designing their ideal glute program. It’s frustrating to put in all those hours of training into a routine, without being sure it’s right for you.
Is your current program right for you?
My answer is always: it depends. On different factors that we will unravel in this article.
No person is the same. Genetics, taking “super supplements”, age, stress levels, taking anti-baby measures (hormonal intervention), how advanced you are, sleep (quality), bulking/cutting; they all influence what your ideal program should look like. A crucial aspect of program design is training frequency, which is what we’ll focus on.
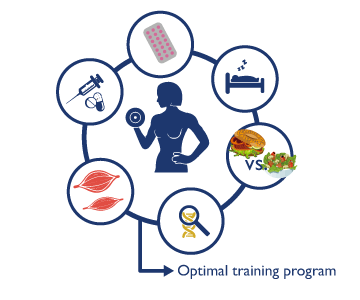
This article explains how to individualize your training program by estimating your ideal glute training frequency. Your ideal frequency is dictated by the stimulus-recovery-adaptation curve. Its length is influenced by two important factors: training status and mental stress. You can instantly apply this knowledge to your training by using the calculators and take another big step towards your ultimate booty-building routine.
Note: This article specifically talks about training frequency for the glutes. However, the same principles apply to all muscles.
Muscle SRA revisited
In the previous article we explored the basics of muscle SRA: a curve that describes how long we should wait before we train the glutes again. Understanding this concept will help you to devise a training program for any point in your training career (stressful times, during injury recovery, while focusing on a different muscle, during holidays, coming back from no training, etc.).
A small recap:
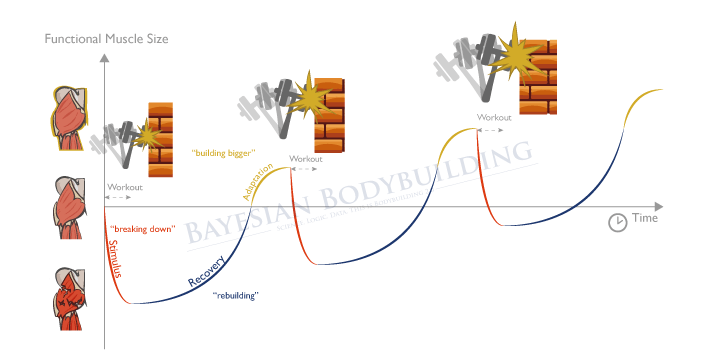
The S in muscle SRA is for Stimulus. It’s the training session that stresses the glutes. Muscle damage occurs. In the Recovery phase (R) the body rebuilds the damaged muscle. Finally in the Adaptation phase (A) of the curve the body builds the muscle bigger than before. The muscle is now more resistant to a future Stimulus (a thicker wall needs a bigger sledgehammer to break it down). The following image illustrates this process.
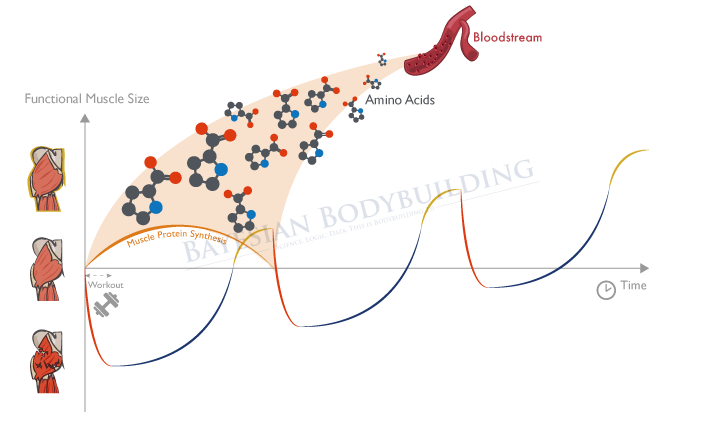
The main process that causes muscle to (re)build bigger than before is muscle protein synthesis (MPS). [Phillips 1997, Damas 2016] It’s the process of adding new protein building blocks (amino acids) to the muscle.
Time length of the SRA curve
So the muscle SRA curve describes the training stimulus and the period after this stimulus. Then MPS increases to ensure recovery and adaptation of the muscle. Exercise type is the first factor that affects the length of this recovery and adaptation period. In my previous article Bret Contreras and I identified the following aspects that determine the exercise type (activator, stretcher, or pumper):
- Average muscle activity
- Range of motion
- Emphasis on the eccentric movement (lowering the weight)
- Muscle length at peak tension (how stretched is the muscle when it’s maximally activated?)
If an exercise scores high in these aspects, the SRA curve gets longer, because recovering and adapting take longer. As we’d expect, doing more volume of that exercise is going to make the curve even longer. [Bartolomei 2017, Burd 2010]
Now here comes another important part of the equation:
Your muscle’s level of development also affects SRA curve length.
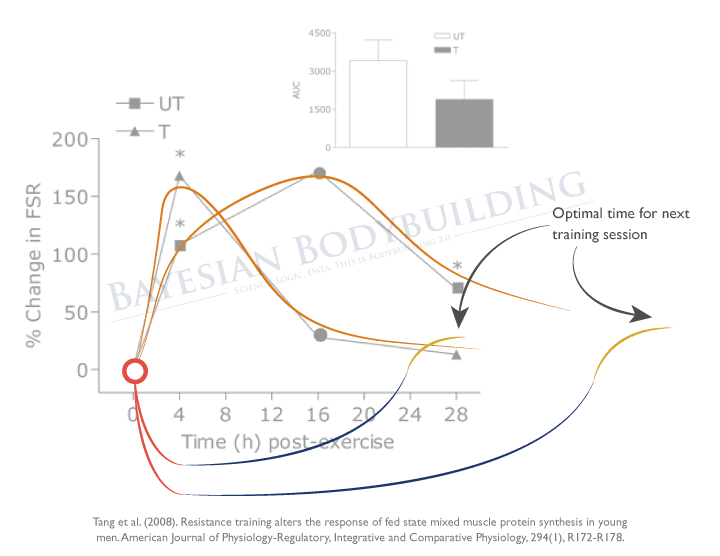
Specifically, undeveloped muscles take longer to complete the SRA curve than developed muscles. [Chesley 1992, MacDougall 1995, Tang 2008]
Researchers don’t exactly know why this is, but it makes sense when you think about it. When you train undeveloped/untrained muscles, the muscles aren’t used to lifting heavy weights, and therefore the training session causes a lot of muscle damage (which you may notice by your Frankenwalk the next day). [Damas 2016]
Also, untrained muscles aren’t very good at repairing themselves yet, probably because they don’t have a lot of ‘satellite cells’, which are essential to muscle (re)building. [Teixeira 2016]
Lastly, the undeveloped muscles still have a lot of size to gain.
Probably for these reasons and others the muscle spends more time recovering and adapting after exercise, which translates to a longer SRA curve.
The bigger and stronger your muscles get, the more resistant they become to the weight training stressor. Training causes less damage, and the room for improvement reaches its limits (after all, you can’t grow indefinitely). Also, the muscles get better at repairing themselves. Probably for these reasons the SRA takes less time to complete.
Take-home message
- To optimize the training frequency of a muscle, we have to know the length of its muscle SRA curve.
- This length depends on the type (and amount) of exercises you do, but a muscle’s level of development also plays a vital role.
A muscle’s training status
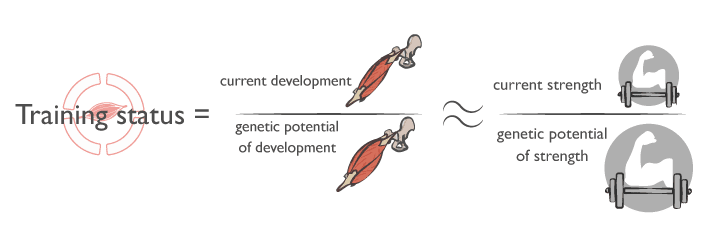
From here on, we’ll use the term ‘muscle training status’ to describe how developed a muscle is. You can assess a muscle’s training status by comparing its current muscle development to its genetic potential of development.
For practical reasons, we’ll divide muscle training status into 4 levels:
- Beginner
- Intermediate
- Advanced
- Elite
Note that training status can differ per muscle. Say for example you’ve always focused on glute training, and you just started giving your shoulders some attention. Then your shoulders will need more rest after a training session than your glutes, as they still have the “beginner” training status.
So how do we measure a muscle’s current level of development? We can’t really measure how big it is directly. Well, a sophisticated CSA scan could, but that’s not an option that suits most people’s budget. Sure, we can take a tape measure or see how it looks in the mirror, but this isn’t very accurate.
A much better way is to look at the muscle’s strength, as a muscle’s strength says a lot about its development. You simply cannot squat 300 lbs for 10 reps and have tiny quads. Research confirms this. [Gilliver 2009, Folland 2007, Akagi 2015, Lietzke 1956, Nuckols 2016] Because they are so closely related it’s a good idea to take a muscle’s current strength as a proxy for how developed it is, which is what we’ll do next.
Take-home message
- After a workout stimulus (S), the muscle repairs itself (R) and builds itself back bigger (A). This process is described by the muscle SRA curve.
- Muscle protein synthesis (MPS) underlies the recovery (R) and adaptation (A) processes.
- How developed a muscle is, is also called a muscle’s training status.
- Training status depends on your muscle’s current development relative to its genetic potential of development.
- The higher a muscle’s training status, the shorter the SRA curve, and the quicker you can train it again.
- Different muscles can have different training statuses.
- We can use muscle strength as a proxy for its development.
Now let’s narrow our scope to the glutes, as in my experience, many women are interested in developing this muscle group. To many women’s delight, more and more men are also starting to see the value of booty gains.
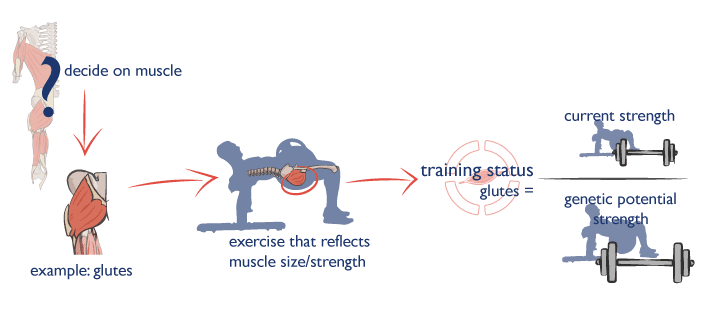
How to determine training status of the glutes
Again, to determine a muscle’s training status we need 2 things:
- Its current strength
- Its genetic potential for strength
To figure out its current strength, we want to look at an exercise that reflects its strength well. Here are some examples.
- Bench press (reflects strength of your chest)
- Barbell squats (reflects strength of your quadriceps)
- Romanian deadlift (reflects strength of your hamstrings and spinal back muscles)
For the glutes, the Hip thrust is a great candidate. So let’s go with that. Next, we need both your current strength and genetic potential for strength in the Hip thrust.
Your genetic potential of strength
To determine your current glute strength we simply have to find your 3-to-8 rep maximum for the Barbell hip thrust. You can enter these numbers into the calculator that’s coming ahead.
Now comes the tricky part: your genetic potential strength in the Hip thrust. Assuming you’re not using a little something-something to boost your performance (anabolic steroids). We can estimate the genetic potential of your Hip thrust strength using 3 factors:
- Your body weight
- Your ankle circumference
- Your index:ring finger ratio
Factor 1: Body weight
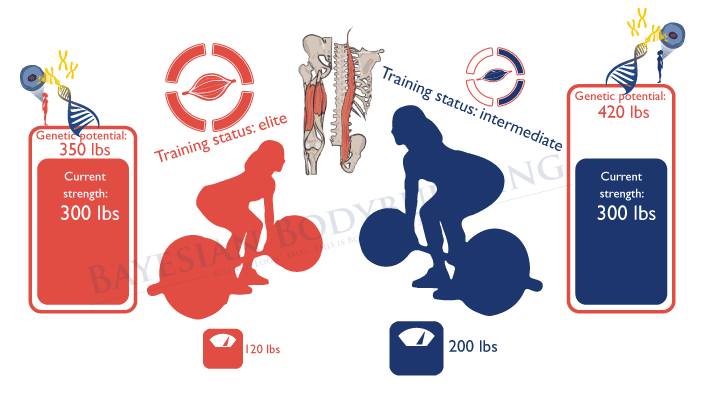
There’s a large body of data showing your body weight accurately predicts your genetic potential of strength for different exercises. An example is the research by Lon Kilgore. Actually, it can radically change someone’s training status for a certain current strength level.
To illustrate this, imagine Jane, who weighs 120 lbs with a maximum deadlift of 300 lbs. Jane’s training status for the hamstrings/spinal erector is higher than Carrie’s, who deadlifts the same maximum weight (300 lbs), but weighs 200 lbs. It’s “easier” for someone with a higher body weight to lift big-ass weights, which is why their genetic potential lies a lot higher. Compared to that higher genetic potential, their training status is lower (intermediate). See the image.
Factor 2: Ankle circumference
Another factor that influences your genetic potential is your ankle circumference. It tells something about the bone frame size of your lower body. The ‘bigger’ your frame, the bigger the ‘muscle coat’ you can wear, and the higher your genetic potential of strength for lower body exercises [Keogh 2006].
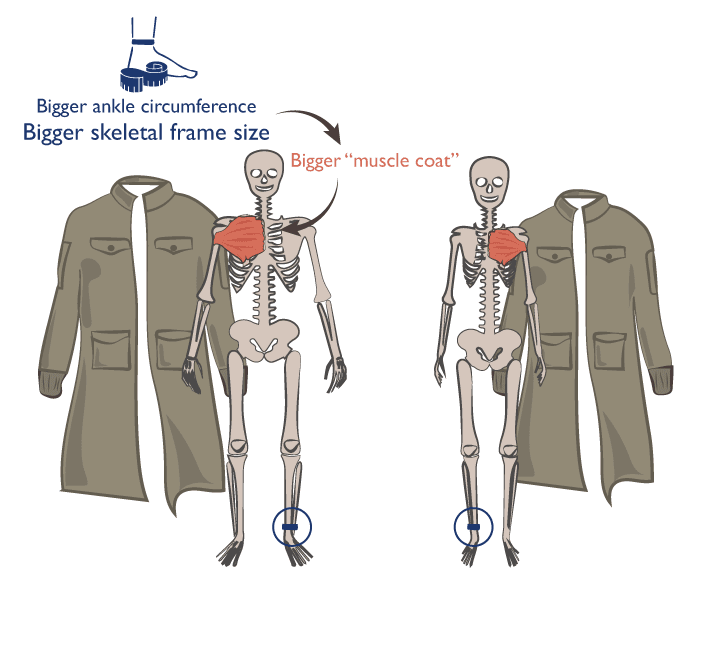
For example, if your ankle circumference is more than 23 cm, you’ve got some great genetic potential right there! [Karakas 2007] Squats, Hip thrusts, and Deadlifts probably come naturally to you.
Factor 3: Index:Ring finger ratio
The third way to assess your genetic potential is to look at the length of your index finger compared to your ring finger. Having a longer ring finger is actually related to more testosterone (yep, the male hormone) exposure in the womb. This influences how strong you can maximally get. [Voracek 2010, Honekopp 2012, Hull 2015]
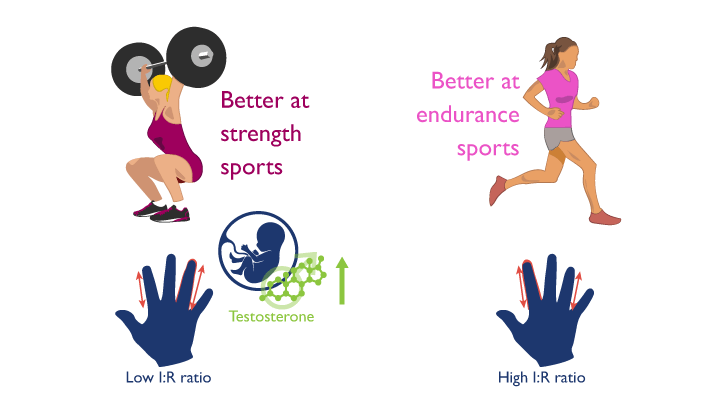
Studies upon studies show that women with a lower I:R ratio are better at “strength-oriented” sports, [Hull 2015] and their grip strength is higher as well. This likely also translates to a higher genetic potential for Hip thrust strength.
As a side-note, women that have big ankle circumference and low I:R ratio are generally also the ones that tend to get a little ‘bulky’ when they start strength training. This is a real thing, and it underscores that these factors indeed affect genetic potential for strength (and muscularity).
Take-home message:
- To calculate the training status of the glutes we need to determine their current strength level and their genetic potential of strength.
- Your Hip thrust strength reflects your current glute strength well.
- 3 important factors influence your genetic potential for Hip thrust strength: your body weight, your ankle circumference, and your index-to-ring finger ratio.
- When we’ve determined the glutes’ training status, we are closer to answering how often we should train them.
Calculating your training status
Now let’s put this all into practice. First we need to determine your 3-to-8 rep maximum in the Hip thrust (with perfect form, as demonstrated by Bret Contreras here). Next, measure your body weight, ankle circumference, and index:ring finger ratio and enter them below.
Note: the next calculations are based on Casey Butt’s frame-size based model of genetic potential, scientific strength data from powerlifters [Brechue & Abe 2002], and studies that investigated how women’s index-to-ring finger ratio influenced maximum strength. [Shen 2016, Lu 2017] With these and our personal experience in mind, Menno and I came to multipliers of 0.928 – 1.072 (+/- 7.2%) for the ankle factor and 0.976 – 1.024 (+/- 2.4%) for the I:R finger factor.
This calculator has been updated on 7 Jan 2018.
(side note: if you want to determine another muscle’s training status, use the StrengthStandards outputs of training status (e.g. chest training status can be determined with Bench press strength).
Now that we’ve determined your training status for the glutes, we’re going to see how this affects their recovery and adaptation time.
Your glutes’ SRA curve
This is where the SRA curve pops back up. For women, the guidelines below describe how long it takes to complete this curve (be recovered/adapted):
Beginner – 48 to 96 hours
Intermediate – 36 hours
Advanced – 24 hours
Elite – 16 hours
These guidelines assume that you perform at least 3 sets of at least one glute exercise per workout (which is normal to most people), because even a beginner/intermediate probably recovers within a day from a training volume lower than that (1-2 sets). [Bartolomei 2017, Burd 2010]
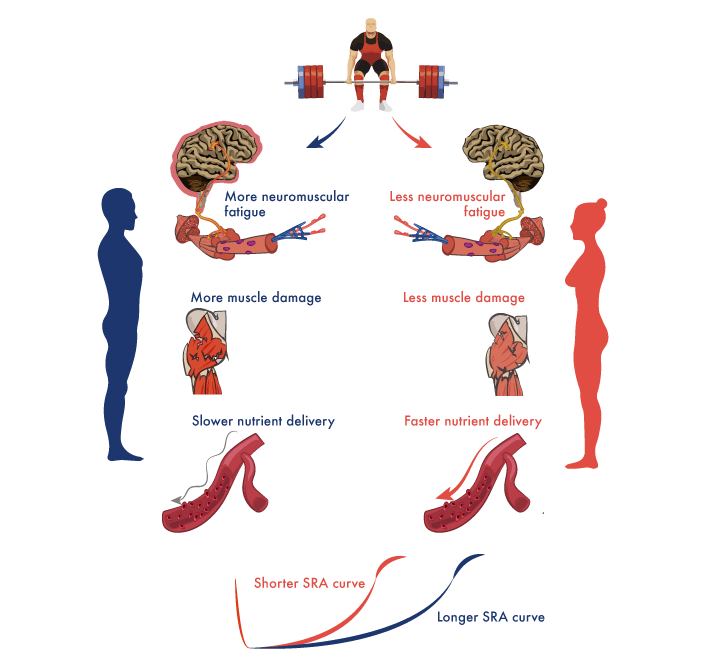
These guidelines are specifically for women. For men, recovery takes longer (SRA curve is longer). [Judge 2010] This is probably because they’re less resistant to neuromuscular fatigue [Hakkinen 1993, Hakkinen 1994] and muscle damage. [Dannecker 2013, Minahan 2015] In addition, nutrient delivery to their muscles is slower. For this reason men should add 6 to 12 hours to these time guidelines.
Mental stress and SRA
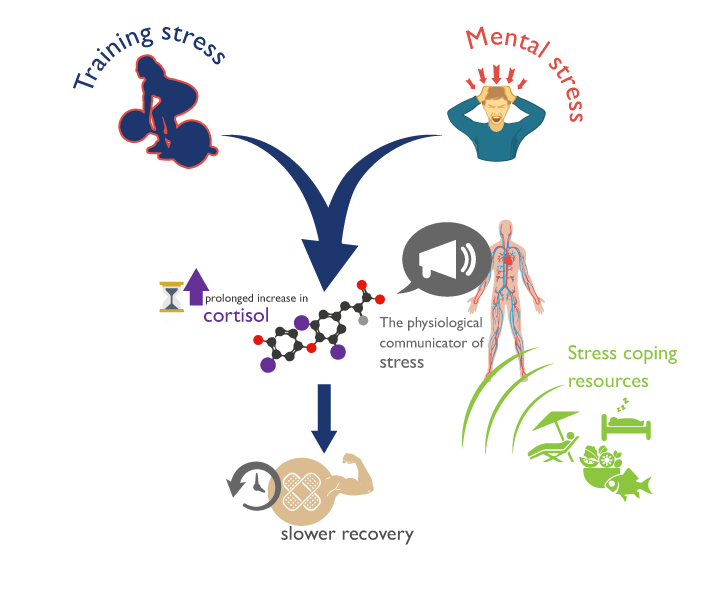
There’s another factor that impacts recovery that we didn’t talk about yet: mental stress. Just like how a workout is a stressor to your body, so can mental stress be. Overdue payments, overwhelming obligations at work, exam periods, a family member who passed away; it’s not just psychological. The body digests the mental stressors in the same way as training stress: with the release of cortisol.
Cortisol is the hormone that ‘interprets’ and communicates stress to the body. As we expect, when stressed out people work out, their cortisol output after training stays elevated much longer. [Perna 1995]
Our body taps into multiple resources to deal with the mental and training demands/stressors. Examples are nutrition, relaxation, and sleep. [Stults-Kolehmainen 2014] If these resources stay the same, but you add mental stress on top of your existing training stress, this means the same amount of resources have to deal with more total stress, which may be why recovery takes longer. [Perna 1995]
Medical science also demonstrates this, as wounds (physical stress) heal slower when a person has high mental stress during recovery. [Walburn 2009]
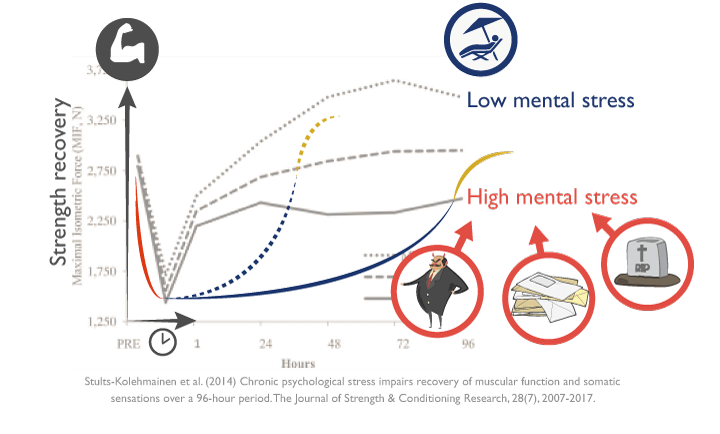
There is limited scientific research that studied the direct effects of more mental stress on muscle recovery. One study showed people with low stress get stronger on a given training program than stressed out ones, which indicates better (and quicker) recovery. [Bartholomew 2008]
Additionally, the most convincing evidence clearly demonstrated that highly stressed students took longer to recover to initial strength levels (in other words: to complete the SRA curve). [Stults-Kolehmainen 2014] How much longer? Up to two times as long. This means that when you’re stressed out by an exam period, you probably need to rest twice as long before training your glutes again.
So we cannot take mental stress lightly. We need to correct the previously calculated SRA length for the mental stress in our lives. Only then can we make a good estimate of how often we should train the glutes.
Take-home message
- The body deals with mental stress the same way as training stress: by releasing the hormone cortisol.
- Cortisol is the physiological ‘communicator’ of stress to the body. When mental stress is high, it stays elevated for longer after a workout.
- For the same amount of resources for recovery (such as relaxation, nutrition, and sleep) having high mental stress makes the SRA curve after a workout up to twice as long.
- If you’re experiencing a lot of mental stress, your optimal training frequency for the glutes is probably lower.
Conclusion and practical application
Multiple factors affect the optimal training frequency for your glutes. My previous article explained how exercise type can influence the length of the SRA curve. Stretchers, such as Romanian deadlifts and Split squats take the longest to recover and adapt from, whereas pumpers, like most band exercises, take the shortest. Activators, such as High step-ups and Hip thrusts are somewhere in the middle.
If you’re like most people, stretchers and activators probably make up the bulk of your program. So not a lot of variation there. However, other factors do vary a lot from person to person: training status and mental stress levels. Your glutes’ training status is their level of development. The more developed they are, the shorter their recovery and adaptation time from a workout, and the more often you can train them. Additionally, if you have a lot of mental stress, this can slow down recovery, so we also have to take that into account.
Next we’re actually going to estimate your glutes optimal training frequency, by entering their previously determined training status and adding your stress levels into the mix.
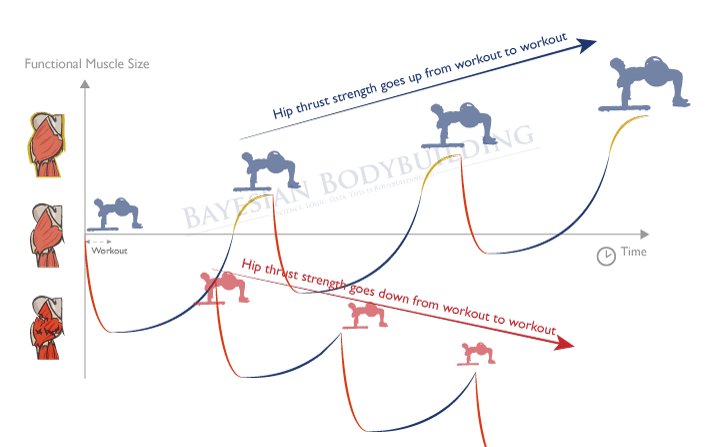
Keep in mind that this number is an estimate. As a ‘second opinion’ you should monitor whether you’re really giving your glutes enough time to recover. A great way to test this is by looking at your hip thrust strength from workout to workout. If you’re getting weaker, the calculator probably underestimated the length of your SRA curve, and you should experiment with resting longer before doing the next workout.
So there you have it. The answer to how frequently you should train your glutes. It may surprise you that it’s a lot more often than you thought. Give it a try, closely monitor how you progress. Hopefully it will bring you closer to designing your perfect glute program. May the booty-gains be with you.

Check out our Online Course
Scientific fitness education for serious lifters. Spend one evening per week to learn everything you need to optimize your physique, strength and health.
About the author
![]()
Stijn van Willigen is a personal trainer and online coach with a bachelor’s degree in Human Movement Sciences and 10 years of experience in the world of weight training and nutrition.
You can find more info about this self-proclaimed “Bayesian Bootybuilder” and his coaching services on:
website: www.bodylogiq.org
facebook: https://www.facebook.com/fitfographs/
instagram: https://www.instagram.com/stijnvanwilligen
References
Akagi, R., Iwanuma, S., Hashizume, S., Kanehisa, H., Fukunaga, T., & Kawakami, Y. (2015). Determination of contraction-induced changes in elbow flexor cross-sectional area for evaluating muscle size-strength relationship during contraction. The Journal of Strength & Conditioning Research, 29(6), 1741-1747.
Bartholomew, J. B., Stults-Kolehmainen, M. A., Elrod, C. C., & Todd, J. S. (2008). Strength gains after resistance training: the effect of stressful, negative life events. The Journal of Strength & Conditioning Research, 22(4), 1215-1221.
Chesley, A., MacDougall, J. D., Tarnopolsky, M. A., Atkinson, S. A., & Smith, K. (1992). Changes in human muscle protein synthesis after resistance exercise. Journal of applied physiology, 73(4), 1383-1388.
Damas, F., Phillips, S. M., Libardi, C. A., Vechin, F. C., Lixandrão, M. E., Jannig, P. R., … & Tricoli, V. (2016). Resistance training-induced changes in integrated myofibrillar protein synthesis are related to hypertrophy only after attenuation of muscle damage. The Journal of physiology, 594(18), 5209-5222.
Dannecker, E. A., Liu, Y., Rector, R. S., Thomas, T. R., Fillingim, R. B., & Robinson, M. E. (2012). Sex differences in exercise-induced muscle pain and muscle damage. The Journal of Pain, 13(12), 1242-1249.
Folland, J. P., & Williams, A. G. (2007). Morphological and neurological contributions to increased strength. Sports medicine, 37(2), 145-168.
Gilliver, S. F., Degens, H., Rittweger, J., Sargeant, A. J., & Jones, D. A. (2009). Variation in the determinants of power of chemically skinned human muscle fibres. Experimental physiology, 94(10), 1070-1078.
Häkkinen, K. (1993). Neuromuscular fatigue and recovery in male and female athletes during heavy resistance exercise. International journal of sports medicine, 14(02), 53-59.
Häkkinen, K. (1994). Neuromuscular fatigue in males and females during strenuous heavy resistance loading. Electromyography and clinical neurophysiology, 34(4), 205-214.
Hönekopp, J. (2012). Anthropometric Digit Ratio 2D: 4D and Athletic Performance. In Handbook of Anthropometry (pp. 1857-1864). Springer New York.
Hull, M. J., Schranz, N. K., Manning, J. T., & Tomkinson, G. R. (2015). Relationships between digit ratio (2D: 4D) and female competitive rowing performance. American Journal of Human Biology, 27(2), 157-163.
Judge, L. W., & Burke, J. R. (2010). The effect of recovery time on strength performance following a high-intensity bench press workout in males and females. International journal of sports physiology and performance, 5(2), 184-196.
Karaka, P., & Bozkir, M. G. (2007). Determination of normal calf and ankle values among medical students. Aesthetic plastic surgery, 31(2), 179-182.
Keogh, J. W., Hume, P. A., Pearson, S. N., & Mellow, P. (2007). Anthropometric dimensions of male powerlifters of varying body mass. Journal of Sports Sciences, 25(12), 1365-1376.
MacDougall, J. D., Gibala, M. J., Tarnopolsky, M. A., MacDonald, J. R., Interisano, S. A., & Yarasheski, K. E. (1995). The time course for elevated muscle protein synthesis following heavy resistance exercise. Canadian Journal of applied physiology, 20(4), 480-486.
Minahan, C., Joyce, S., Bulmer, A. C., Cronin, N., & Sabapathy, S. (2015). The influence of estradiol on muscle damage and leg strength after intense eccentric exercise. European journal of applied physiology, 115(7), 1493-1500.
Perna, F. M., & McDowell, S. L. (1995). Role of psychological stress in cortisol recovery from exhaustive exercise among elite athletes. International Journal of Behavioral Medicine, 2(1), 13.
Phillips, S. M., Tipton, K. D., Aarsland, A. S. L. E., Wolf, S. E., & Wolfe, R. R. (1997). Mixed muscle protein synthesis and breakdown after resistance exercise in humans. American journal of physiology-endocrinology and metabolism, 273(1), E99-E107.
Raastad, T., Glomsheller, T., Bjøro, T., & Hallen, J. (2003). Recovery of skeletal muscle contractility and hormonal responses to strength exercise after two weeks of high-volume strength training. Scandinavian journal of medicine & science in sports, 13(3), 159-168.
Stults-Kolehmainen, M. A., Bartholomew, J. B., & Sinha, R. (2014). Chronic psychological stress impairs recovery of muscular function and somatic sensations over a 96-hour period. The Journal of Strength & Conditioning Research, 28(7), 2007-2017.
Tang, J. E., Perco, J. G., Moore, D. R., Wilkinson, S. B., & Phillips, S. M. (2008). Resistance training alters the response of fed state mixed muscle protein synthesis in young men. American Journal of Physiology-Regulatory, Integrative and Comparative Physiology, 294(1), R172-R178.
Teixeira, E., & Duarte, J. A. (2016). Skeletal muscle loading changes its regenerative capacity. Sports Medicine, 46(6), 783-792.
Voracek, M., Reimer, B., & Dressler, S. G. (2010). Digit ratio (2D: 4D) predicts sporting success among female fencers independent from physical, experience, and personality factors. Scandinavian journal of medicine & science in sports, 20(6), 853-860.
Walburn, J., Vedhara, K., Hankins, M., Rixon, L., & Weinman, J. (2009). Psychological stress and wound healing in humans: a systematic review and meta-analysis. Journal of psychosomatic research, 67(3), 253-271.
 Want more content like this?
Then get our free mini-course on muscle building, fat loss and strength.
By filling in your details you consent with our privacy policy and the way we handle your personal data.
About the authors

Stijn van Willigen
Stijn has a BSc in Kinesiology and has been working on the Henselmans team as a content editor and researcher for over 2 years. He is also an online coach, writer, and entrepreneur, having launched his own meal planning algorithm. You can find more about him on his website www.bodylogiq.org or his Instagram (www.instagram.com/stijnvanwilligen) where he posts tons of infographics on science.

Menno Henselmans
Formerly a business consultant, I've traded my company car to follow my passion in strength training. I'm now an online physique coach, scientist and international public speaker with the mission to help serious trainees master their physique.