
Individualized program design: the next step in evidence-based fitness [Article]
Bret Contreras and James Krieger recently published a great article about how people respond differently to exercise and dieting: “Individual Differences: The Most Important Consideration for Your Fitness Results that Science Doesn’t Tell You.” They showed considerable variation in how each individual responds to exercise and concluded that good training and nutrition programs should take these individual differences into account. Not everyone responds as well to the same program.
This is a message that cannot be overstated: optimized program design requires individualization. Just like suits, the best fitness programs are custom tailored.
However, this message of individualization is also a dangerous one and can open the flood gates of broscience.
“You know that detox diet has no scientific basis whatsoever, right?”
“Well, it worked for me.”
When does individualization turn into broscience?
Note: If you have no interest in interpreting scientific studies or statistics or logical reasoning, you can skip to the Applications sections.
Variance vs. individual differences
Understanding the statistical concept of variance is crucial to interpreting science. For example, one study cited in Bret and James’s great article is Karavirta et al. (2011), which investigated the effect of combined strength and endurance training. As I have harped on repeatedly at Bayesian Bodybuilding, adding endurance training or cardio to your strength training program (concurrent training) can reduce muscle growth and strength development (the interference effect). Karavirta et al. wanted to see how people differ in their response to concurrent training. Bret and James showed the following graph of this study’s results.
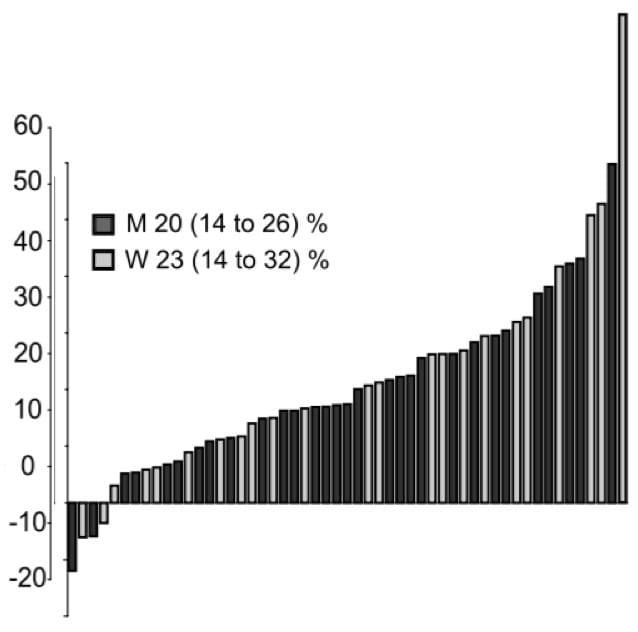
“This graph represents the isometric leg press force gained over a 21-week period of training. One subject got 12% weaker, while another subject got 87% stronger!”
Statisticians refer to this as variance: people varied in their response to the training program. And the variance was indeed large. You can quantify the variance mathematically and you can even standardize it to compare the variance of different things using the coefficient of variation (CV). This allows us to compare variance across different domains. For example, we may see that energy restriction results in fat loss for almost everyone, but some people lose much more fat than others in response to cardio.
However, the danger here is jumping to the conclusion that some people experience the interference effect as normal, whereas others increase their squat gains when they take up jogging. Variance says nothing about causation. So some people gain more strength than others during concurrent training. Maybe they just worked harder. Maybe they had better genes. In any case, this study does not in any way prove that some people consistently gain strength whereas other people consistently lose strength when they add cardio to their strength training program. It simply shows there is variance in the rate of strength development. The results don’t tell us anything about what caused the variance. As Karavirta et al. themselves stated: “the examination of possible determinants of trainability was beyond the scope of the present study”.
Correlation vs. causation revisited
We can get one step closer to an actual need for program customization by analyzing the reason for the variance. For example, we have Finlayson et al. (2009), another study cited by Bret and James: “The researchers looked at the compensatory response to the exercise session. In other words, if you burned 100 calories in a workout, would you then make up for it by consuming 100 calories later?
The following graph shows the variation in compensatory eating from one subject to the next. The solid line indicates where calorie intake was equal for the exercise and no-exercise conditions, meaning there was no compensation at all (i.e., the subjects did not eat food to make up for the calories burned in the exercise session). The dashed line indicates where the subjects perfectly compensated for the calories burned during exercise (e.g., if they burned 100 calories, they ate 100 calories). Thus, subjects between the solid and dashed line showed only some compensation (e.g., burning 100 calories but eating 50), while subjects at or above the dashed line showed perfect or overcompensation (meaning they ate more than they burned in the exercise session).
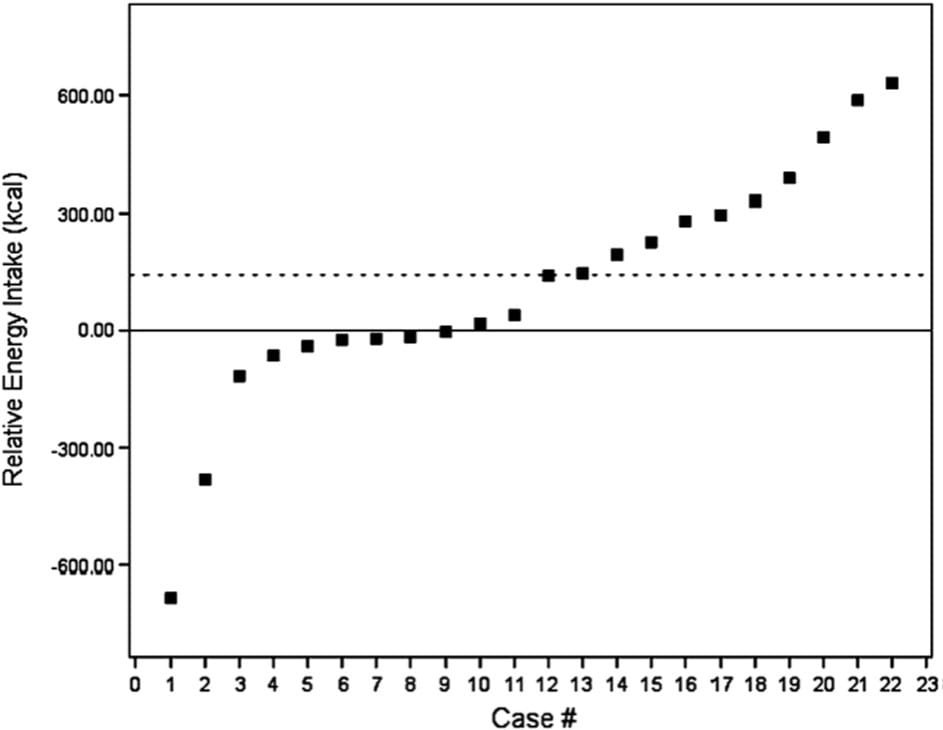
Look at the wide variation in responses.
A couple of people ended up with 300-600 calorie deficits after the exercise session, yet several people ended up with 300-600 calorie surpluses! The former group saw amplified results on account of their decreased caloric intake following the cardio session, whereas the latter group sabotaged their fat loss efforts by consuming more calories than they burned during the cardio session.”
Here again we have variance. And the danger is again that we attribute causation to this variance: this study does nót prove that some people consistently experience an increase in appetite while others consistently experience a decrease after cardio. It just shows there is variance in how cardio affects your appetite.
To investigate the actual effect of cardio on your appetite, the researchers performed statistical significance testing. Significance testing is done exactly because it allows us to see past the averages: it takes variance into account. There will always be variance in research, but this does not mean we have truly individual responses.
For example, let’s say a study compares 1 set vs. 3 sets of bench presses per week for muscle growth and it finds that the 3-set group experienced a 6% increase in muscle growth, whereas the 1-set group experienced a 7% increase. Does this mean 1 set is better than 3 sets? We have to account for variance. In such a study, high variance is normal. Exercise science is a poorly funded field where it’s difficult to gather a lot of subjects and get them to meticulously adhere to the study program. There’s also considerable genetic variation in how fast people can gain muscle. Maybe Ronnie Coleman Jr. happened to be a participant in the 1-set group and gained so much muscle he lifted the whole group average up 2% (no pun intended), skewing the results in favor of the 1-set group. Statistical significance testing shines by taking this into account.
In the case of Finlayson’s study, the statistical significance test showed that energy intake was not significantly different between the exercise and no-exercise groups, providing strong evidence that cardio does not affect your appetite. On average. Here the researchers went one step further than Karavirta et al. and managed to find potential reasons to explain the variance in compensatory eating. They divided the subjects into ‘compensators’ and ‘non-compensators’. Again, it is worth emphasizing this in itself does not tell us anything.
Do not be fooled by the labeling: it adds no evidence. All these results show so far with any confidence is that cardio most likely does not affect your appetite and that there is variance in the effect. But the following does add evidence: the researchers tested many differences between compensators and non-compensators, like their body fat percentage, appetite and how much they liked the foods eaten in the study. The compensators were found to have a different hedonic response to food after exercise. This suggests people differ in how much pleasure they experience during their post-workout meals.
So here we have a plausible mechanism that actually has practical implications for program design. Maybe some people experience an increase in the pleasure of eating after a workout, whereas others do not. This would make them more likely to overeat after exercise and maybe that’s why they are compensators and other people are non-compensators.
However, this is still fickle evidence. It is just a correlation. Better than pure variance, but correlation does not imply causation. Just because people differed in the degree of compensatory eating and just because this degree happened to be associated with differential enjoyment of food after exercise, this does not mean that the differential enjoyment of food after the exercise caused increased energy intake. There could be a different factor that caused both. For example, maybe subjects in the compensator group happened to be more sleep deprived and when combined with the stress from exercise (exercise is in physiological terms a form of stress), this changed their food preferences and energy intake.
You may think: “Ok, that’s interesting and all, but isn’t the practical implication still that some people respond better to cardio than others when trying to lose fat?” If we assume that the correlation is causation and this is a genetic difference, then yes: the take-home message is that some people have less to gain from cardio than others. In this case, it will just increase the likelihood of overeating afterwards. However, if the correlation was mediated by sleep deprivation, then the take-home message radically changes to: “Cardio is a good way to reduce your energy intake, as it burns energy and does not increase your appetite. However, you may want to avoid it when you are sleep deprived.”
Big difference. This is why knowing the cause of variance is so important.
Even worse, maybe the association between food enjoyment and compensatory eating after cardio was just what researchers call a spurious correlation. If you’re looking at 2 self-created groups of people, like compensators and non-compensators, and you test how they differ on many different measures, there’s a good chance you’re going to find at least sóme measure the groups differ on. This is again just normal variance that needn’t necessarily mean anything. Different people are just different, but this doesn’t mean they also react differently to cardio.
Statisticians sometimes call this data dredging: trying to find patterns in data áfter a study has concluded. A follow-up study on the effect of cardio on appetite supports that Finlayson’s findings were indeed just random variance: “Between participants, there were notable differences in responses; however, a large proportion of this spread lay within the boundaries of normal variation associated with biological and technical assessment error… In young men, acute exercise suppresses hunger and circulating acylated ghrelin concentrations with notable diversity between individuals. Care must be taken to distinguish true interindividual variation from random differences within normal limits.”
A priori vs. post hoc analysis
So can science then only tell us anything about group averages and not individual differences? Are we just left to experiment to find individual differences? On the contrary! Science goes far beyond group averages and allows us to find out the how and why of individual differences. We just need to step up our science game when we delve into these complex topics.
We already saw 1 aspect of individual differences that needs to be taken into account: we want to look not only at variance but also the reason behind the variance. There should be a plausible theory of why certain people react differently to, say, cardio. Mere correlation can provide hints, but for scientific rigor we need to establish causality.
Causality requires chronology. Something cannot cause something else to occur in the past. As such, a good study classifies individual differences a priori: this means the researchers decide before the study which person goes into which group. For example, a replication of Finlayson’s study on compensatory eating after cardio could be done where the subjects were grouped into expected compensators and expected non-compensators. Then we can test if these 2 groups truly differ in how much they eat after a cardio session.
Here are 3 example applications of systematic differences in which type of diet and training program we best respond to.
Application 1: Gender based training programming
Women respond differently to exercise than men. Here are 9 reasons why women should not train like men and how their programs should differ.
Application 2: high vs. low carb
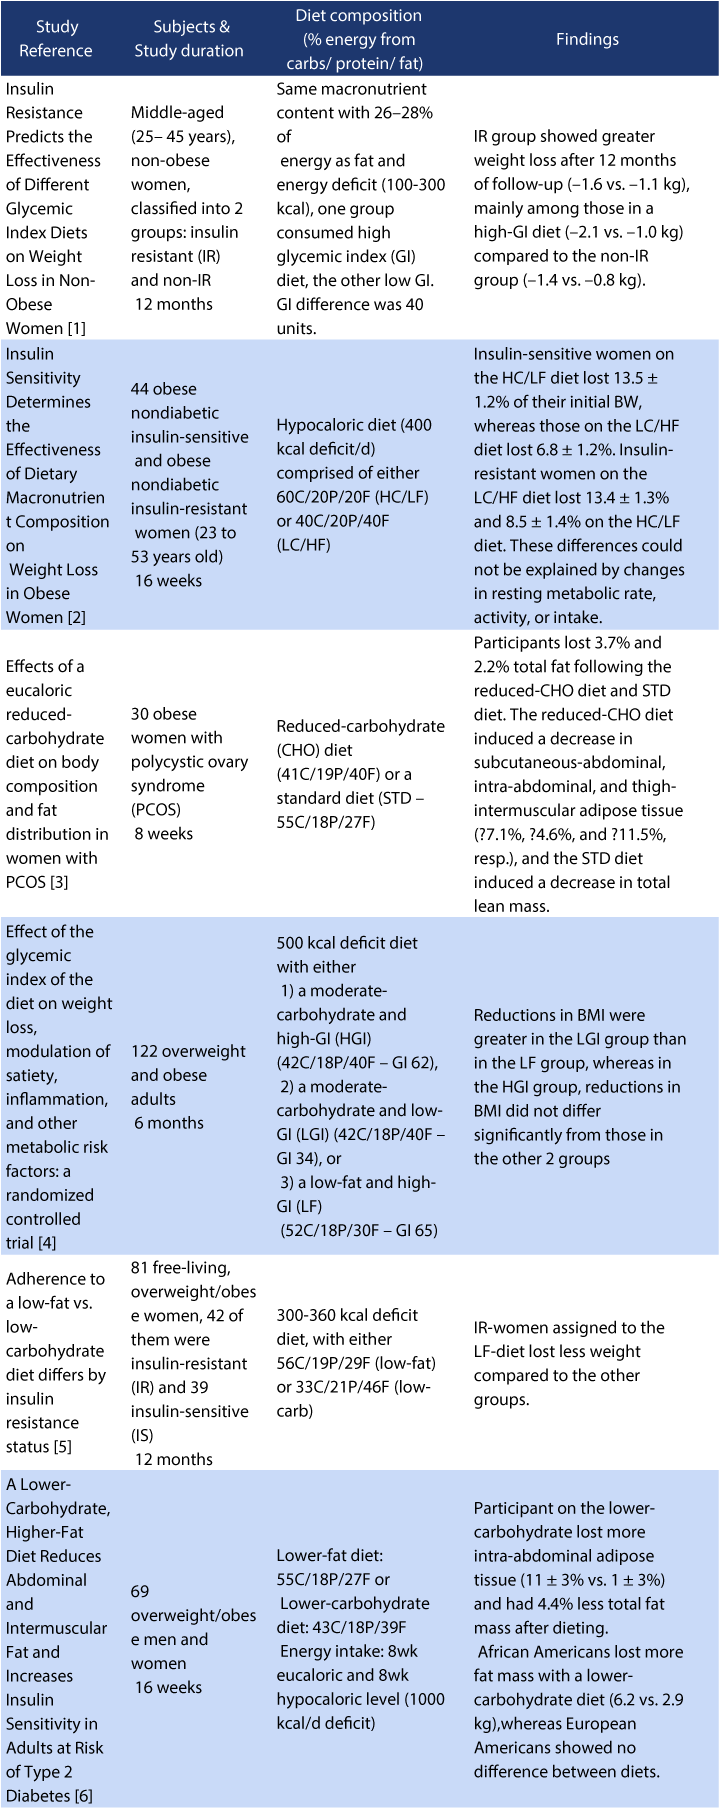
Which is best for fat loss: a high or a low carb diet? For many people, finetuning the carb-to-fat ratio of the diet is an overrated aspect of the diet compared to total energy intake. However, certain people do better on low carb diets and others do better on high carb diets. Below is an overview of studies finding significant differences in weight or fat loss success on a high or low carb diet from our online PT Course. Importantly, all these studies compare diets that differ only in the ratio of carbs to fat or even only the glycemic load of the diet.
Protein and total energy intake are the same in both groups. Several studies also controlled for diet adherence, indicating differences were unlikely to be the result of compliance problems and may be genetic or at least physiological. Indeed, researchers have already identified some of the genes responsible for carb hyper-responsiveness. The notorious ‘fat mass and obesity–associated gene (FTO)’ may also play a role in carb tolerance.
The general trend in these studies is that the worse your insulin sensitivity, the more likely you are to respond favorably to a low carb diet. If you have full-blown type II diabetes or metabolic syndrome, there is a very good chance you’ll lose more fat on low carb than a low fat diet, even when total energy intake and protein are the same.
However, insulin sensitivity is only one aspect of ‘carbohydrate tolerance’. What seems to matter most is if the individual releases an appropriate amount of insulin relative to their insulin sensitivity. The first study in the table, for example, found that insulin resistant individuals lost more fat on a high glycemic load diet. In other words, the insulin resistant seemed to be better off eating white bread than whole-grain bread. This may be a scenario analogous to subclinical type I diabetes, where the body benefits from a little outside help to achieve sufficiently high insulin levels.
In practice, you may not have bloodwork available to test your carbohydrate tolerance. Many people decide intuitively whether they have good carb tolerance or not. This is a mistake. Most people don’t know if they have good carb tolerance or not. Allowing people to self-select a low carb or high carb diet does not improve diet adherence or weight loss success compared to randomly allocating them to either diet.
Instead, you should rely on objective indicators of carbohydrate tolerance, particularly your diet history, age, body composition and gender.
Application 3: high vs. low volume
Here are 3 extremely cool studies on how different people respond differently to training and have a different program that is optimal for them.
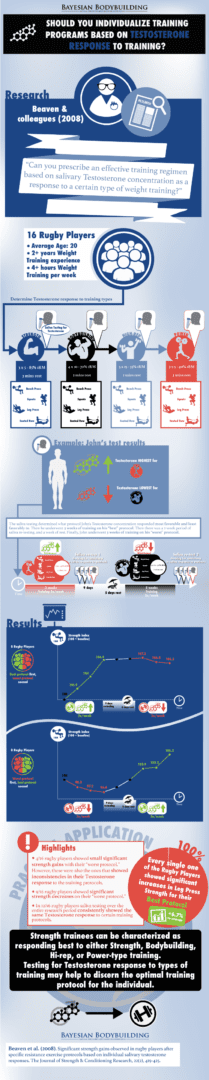
I discuss the first study in this excerpt of our online PT Course. This is perhaps the most underrated study in the whole of exercise science, showing extreme individuality in what program is best.
Here’s an infographic of the whole study for those interested in the details (click on it to open it in full-screen in a new tab).
If you don’t have access to saliva tests or bloodwork, how do you know which program is optimal for you? The T/C ratio is a marker of recovery status, so you can get a good idea of which type of training you respond best to by seeing how long it takes you to recover from certain training. Recovery is strongly influenced by training volume and most research supports that total training volume is the most important variable in any training program to optimize. Things like your rest interval and even training frequency seem to be mostly important because they affect your total training volume: more rest and higher training frequencies are convenient ways to increase your training volume, which can thereby increase muscle growth.
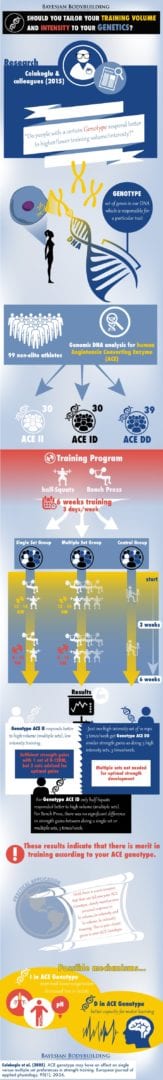
This brings us to our second study. Colakoglu et al. (2005) used a remarkably detailed study design to study how the effects of training set volume (1 vs. 3 sets) and training intensity (8-12 RM vs. 12-15 RM) differed between people with a different ACE genotype. Whereas people with the ID or II genotype gained more strength when performing more sets, as most people do, people with the ACE DD genotype, which is associated with a greater proportion of fast twitch muscle fibers and great potential for strength and power sports, did not gain more strength when performing a higher training volume at either intensity.
Moreover, individuals with the opposite ACE II genotype gained more strength with 12-15 RM loads than with 8-12 RM loads. Overall strength development was highest in the order of DD > ID > II. “These data suggest that ACE I-allele might be responsible for better response to high volume—low intensity muscular endurance training while D-allele might be related to better strength development with higher intensity—lower volume resistance training.”
See the the infographic below for the full study details if you’re interested (click on the infographic to open it in full-screen in a new tab).
It seems people respond best to the type of exercise they’re genetically good at. This corresponds perfectly with what you’d expect based on their muscle fiber type composition and what we see in elite athletes. David Epstein covers this topic in detail in his awesome book The Sports Gene. Individuals that are naturally good at sprinting tend to have fast twitch dominant muscles and respond well to explosive, high intensity training, yet they are susceptible to overreaching from performing too much volume. When I see a client has a background in high level explosive sports, I know we can make great progress. On the other hand, I’ve had several clients that came from a background of high level endurance training and almost all of them are typical hardgainers. Yet their work capacity and volume tolerance are generally off the charts. I’ve found that the key to make them achieve similar gains to more genetically average individuals is to have them perform more volume.
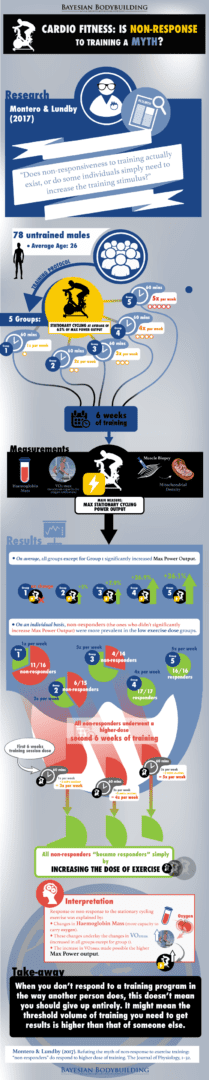
This brings us to the third study, which supports that non-response to exercise and being a hardgainer may be a myth. Some individuals just need more volume to make progress. Normal training volumes may not provide enough stress for these individuals to cause their bodies to adapt.
See the infographic below for the full study details for those interested in the details (click on the image to open it in full-screen in a new tab).
Conclusion: systematic vs. ad hoc program customization
Bret and James wrote a hugely important message in evidence-based fitness: we need to look beyond averages and take individual differences into account in our training and nutrition programs. The next step is specifying hów we should achieve this.
In the current fitness industry, there only seem to be 2 approaches to individualizing programs. On the one hand we have the bros whose interpretation of ‘customization’ is randomness. They have a vague idea – a feeling – of how different individuals respond better to different programs. However, there is no system. All customization is done ad hoc, on the fly. So identical clients could get wildly varying programs, which makes no sense.
One the other hand we have the robotic science crowd who never deviate from the ‘optimal system’. Here identical clients will rightfully get the same program, but so will an old male Olympic level sprinter and an adolescent female former marathon runner that’s now getting into strength training. This one-size-fits-all method also doesn’t cut it.
No, the fitness industry needs to step up their game and implement systematic individualization. For example, good training programs have a clear rationale for why women should train differently than men and how your program should change as you get more advanced. No more cookie cutter programs. No more blindly copying the jacked guy. Individualize your program to your body and you will unleash your full inner potential.
With contributions of Joe Flaherty
 Want more content like this?
Then get our free mini-course on muscle building, fat loss and strength.
By filling in your details you consent with our privacy policy and the way we handle your personal data.
About the author

Menno Henselmans
Formerly a business consultant, I've traded my company car to follow my passion in strength training. I'm now an online physique coach, scientist and international public speaker with the mission to help serious trainees master their physique.